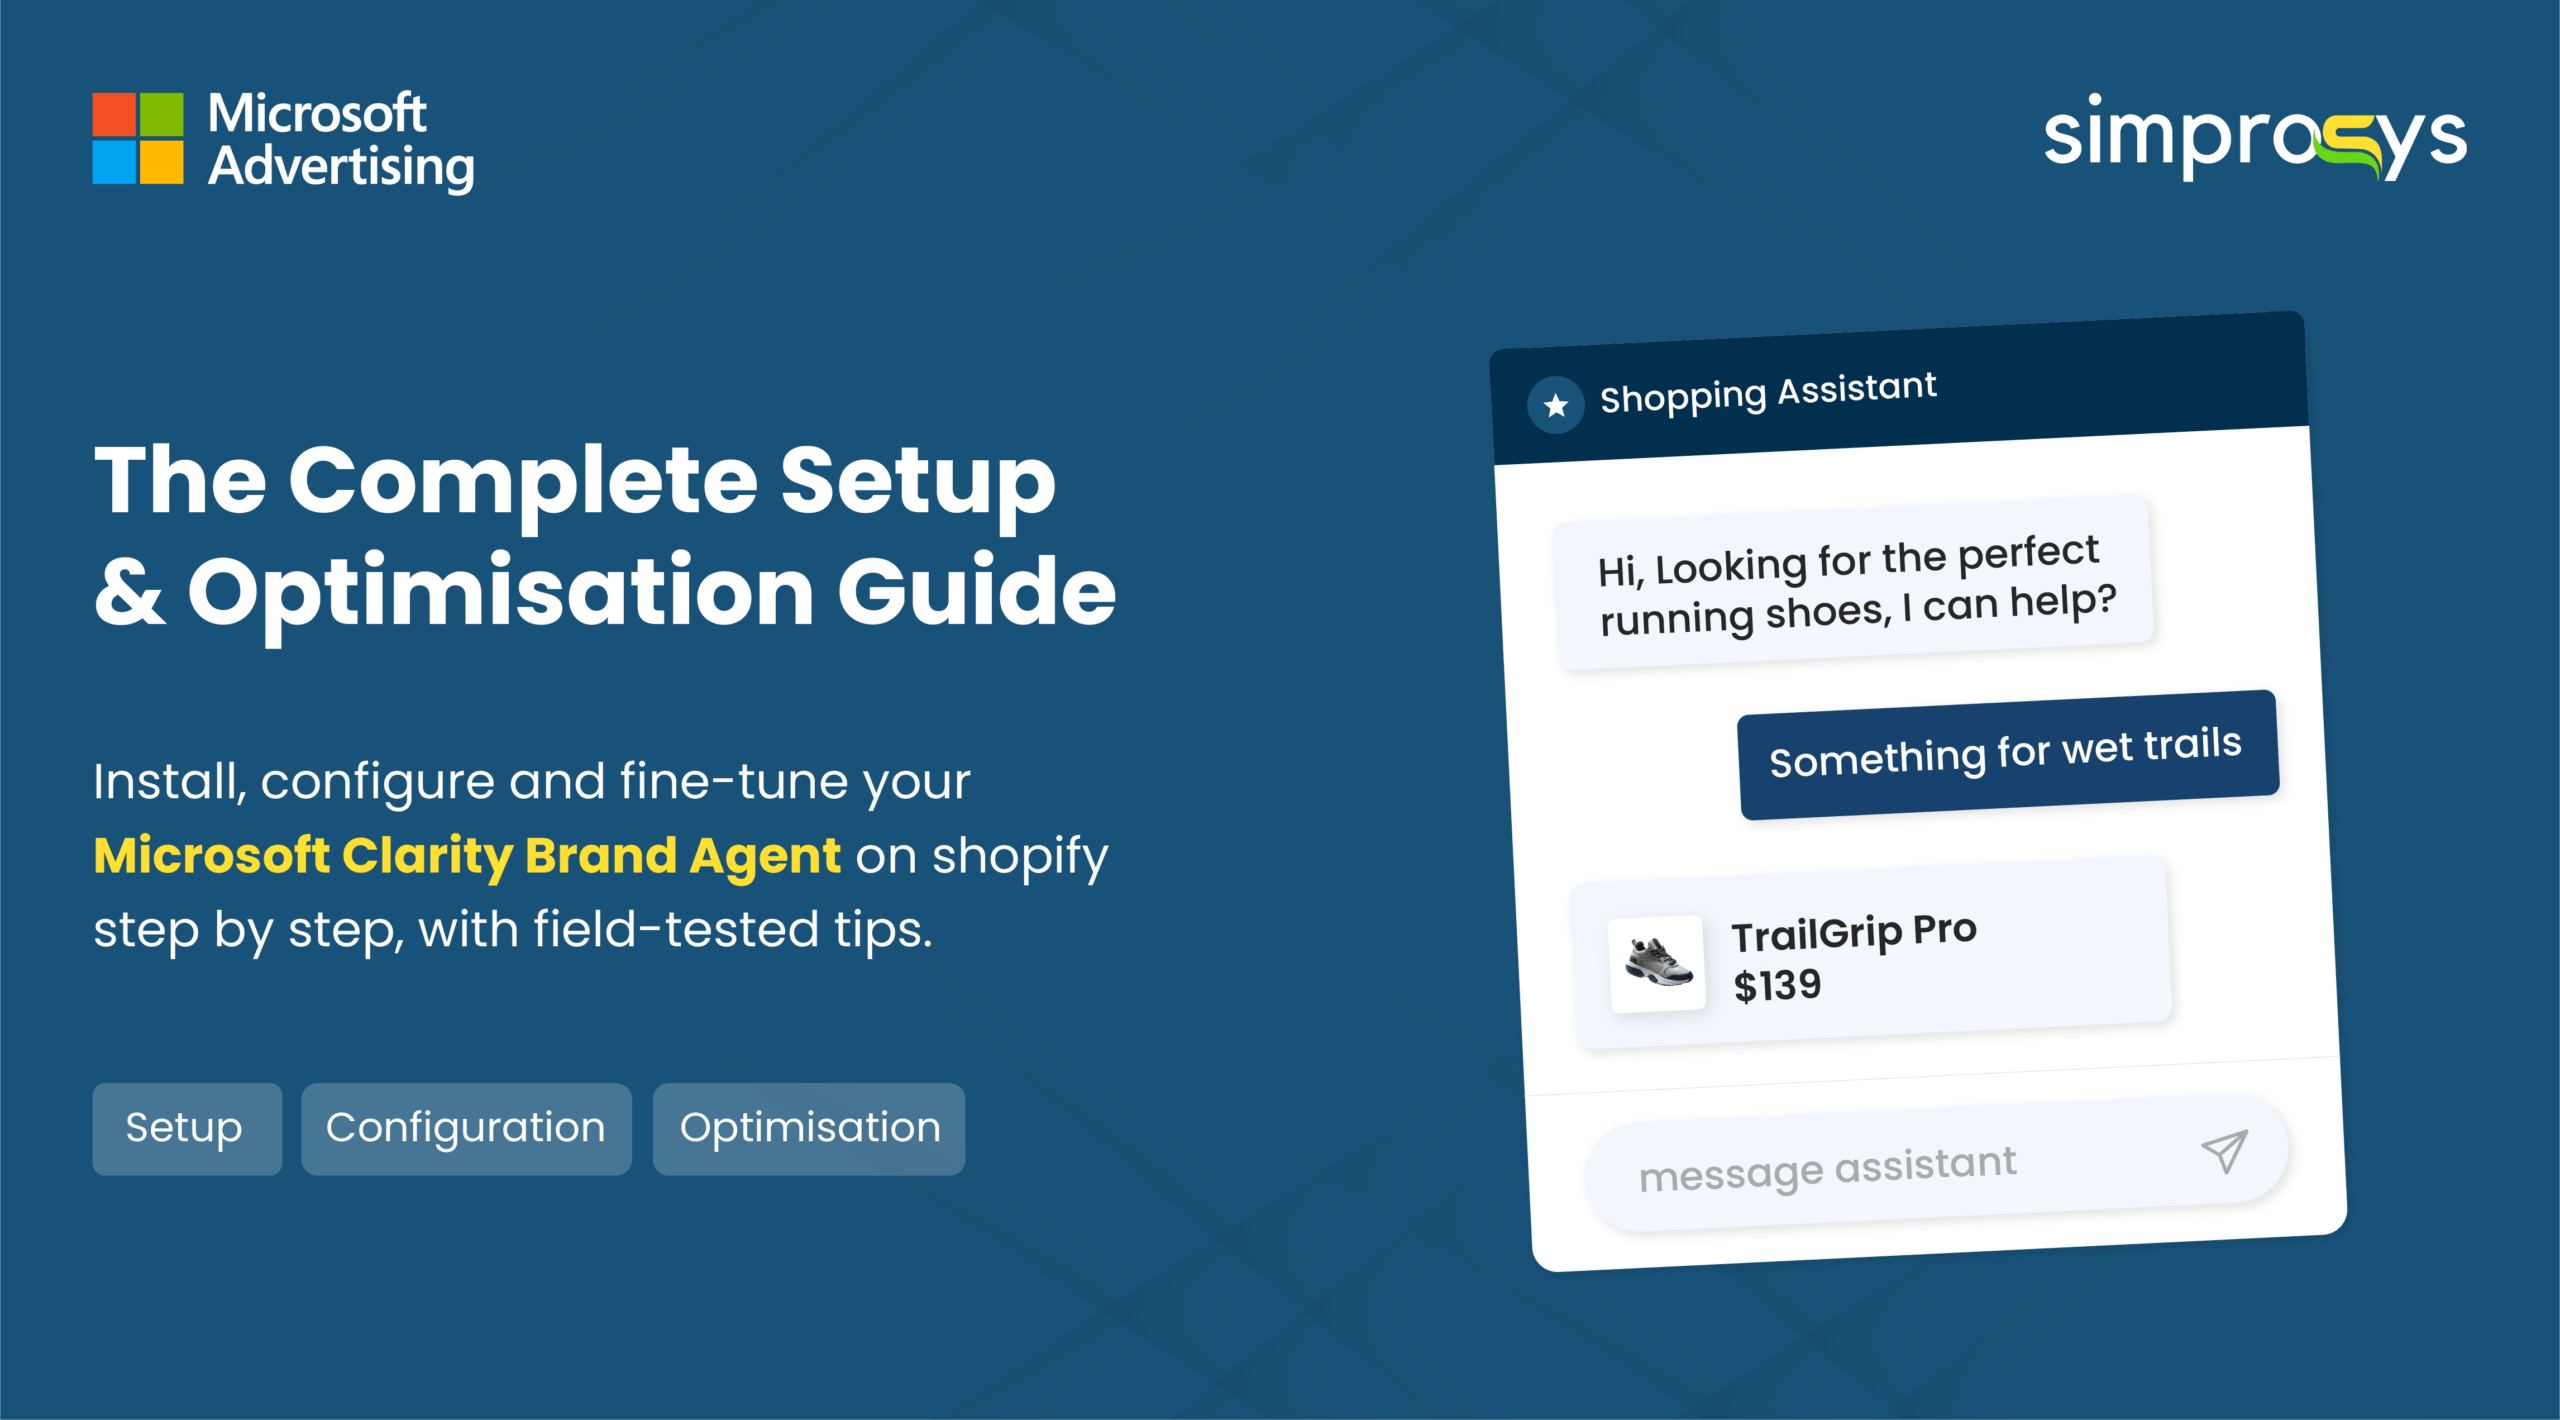
Turn Your Storefront Into a Smart Sales Associate with Microsoft Clarity Brand Agents
A complete setup tutorial for Shopify merchants from first install to live, branded AI conversations that guide shoppers to checkout. […]
A complete setup tutorial for Shopify merchants from first install to live, branded AI conversations that guide shoppers to checkout. […]
Every shopper on Google is silently asking one question: Can I trust this store?The Store Quality Page in Google Merchant […]

Your Shopify store is doing well in your primary market, and now you’re thinking about reaching customers globally. How will […]
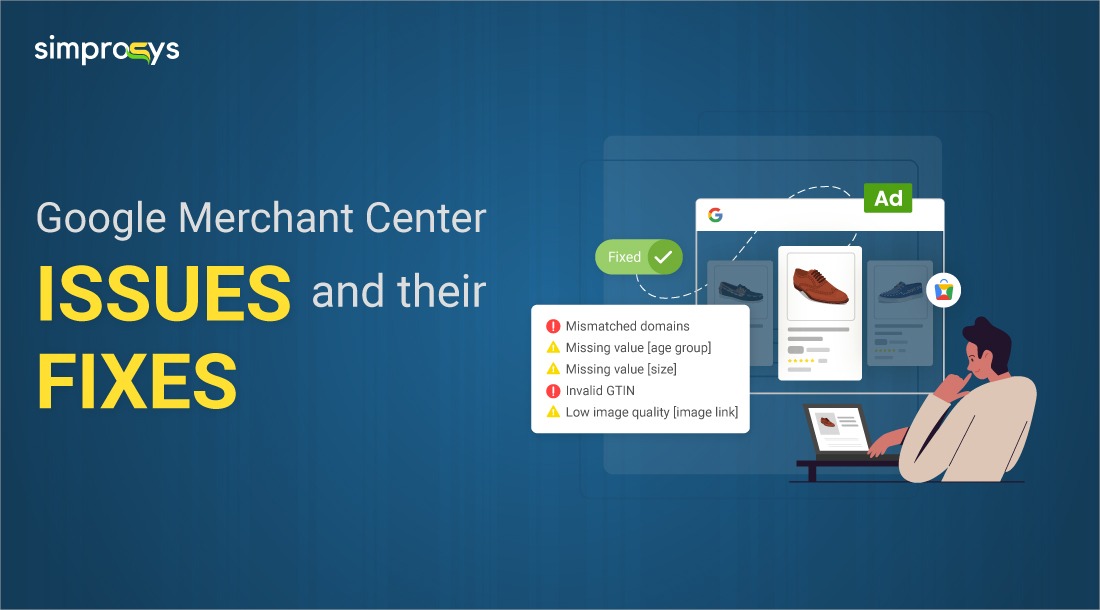
Listing your products on Google Shopping starts with an error-free product feed in Google Merchant Center (GMC). Common issues include […]